
Albertans Want and Expect Kenney to Lose Leadership Review
Jared Wesley | University of Alberta | jwesley@ualberta.ca
May 16, 2022
On May 18, 2022, the results of the UCP leadership review will be released to the general public. At stake is the political future of Jason Kenney as UCP leader, and presumably as premier. Registered UCP members will decide whether to keep or remove him, with ballots already cast by mail.
Given the tumultuous state of Alberta politics over the past decade, it is difficult to confine the impacts of the outcome to one person’s political career. For many observers, the vote is also a referendum on the how well uniting Alberta’s right under a single partisan banner has gone over the last several years.
Kenney is adamant that the results of the review vote should be judged on a majoritarian basis. In other words, he intends to stay on as leader if he secures ‘yes’ votes from more than 50 percent of UCP members who mailed in their ballots over the past 5 weeks. His critics point out the challenges involved in trying to hold a party together without an overwhelming majority, and the precedent set by other party leaders who resigned when they received fewer than two-thirds support from members.
Our Viewpoint Alberta survey was in the field during the final month of the leadership review process. The results reveal that a majority of Albertans think UCP members should oust Kenney from the leadership, and that they expect that to be the ultimate result on May 18. A slimmer majority have faith in the process, however, suggesting that a large proportion of the population may question the results once they are released. Given these results, a Kenney victory could lead to instability in Alberta’s political climate.
The Premier’s Popularity
While it remains well below that of his primary opponent, NDP Leader Rachel Notley, Kenney’s popularity has recovered somewhat over the past six months (see Figure 1). After reaching an ebb in Fall 2021 (when his mean score on our likeability scale was 2.7 out of 10), he has regained the position he held a year ago (3.2). At 3.1, Kenney’s popularity once again aligns with that of Prime Minister Justin Trudeau
Figure 1. Leader Approval Ratings, 2019-2022
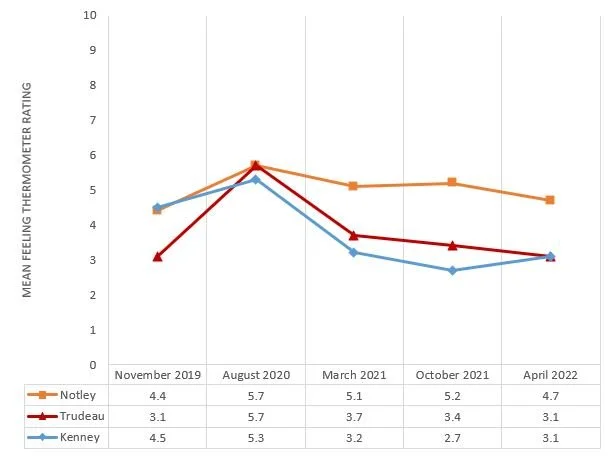
Source: Viewpoint Alberta Survey 2019 (n=820), Viewpoint Alberta Survey 2020 (n=824); Viewpoint Alberta Survey March 2021 (n=802); Viewpoint Alberta Survey October 2021 (n=1204); Viewpoint Alberta Survey April 2022 (n=2151). Weighted data. Figures Correspond to the question: “What do you think about the party leaders in provincial and federal politics? On a scale of 0 to 10, where 0 means you really dislike the leader and 10 means you really like the leader, how much do you like….?
Nearly two-thirds of Albertans (63 percent) hold a negative view of Kenney on this feeling thermometer measure, compared to one-in-four who hold a positive view (24 percent) (see Figure 2). These numbers once again track well with feelings about Trudeau. By comparison, an equal percentage of Albertans hold negative and positive views of Notley (42 percent); these ratings are very close to those of federal NDP leader, Jagmeet Singh. It is worth noting that most Albertan’s have not formed an opinion about Paul Hinman (61 percent), the leader of the third-strongest party in the province, the Wildrose Independence Party.
Figure 2. Positive and Negative Assessments by Leader, April 2022
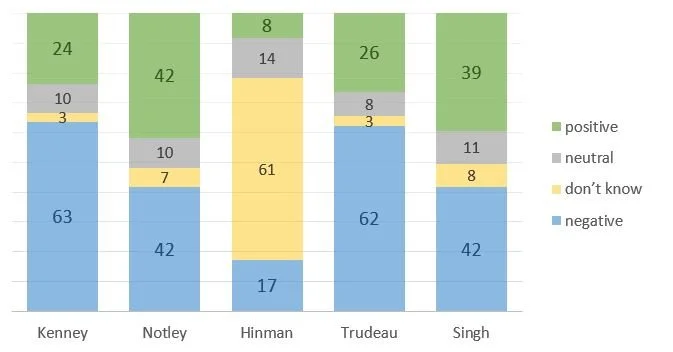
Source: Viewpoint Alberta Survey, April 2022. N=2151. Weighted data. Based on survey question: “What do you think about the party leaders in provincial and federal politics? On a scale of 0 to 10, where 0 means that you really dislike the leader and 10 means that you really like the leader, how much do you like...?” Responses from 0 to 4 were coded as negative, 5 as neutral, and 6 to 10 as positive.
Negative views of Premier Kenney persist across all demographic groups (see Figures 3 to 5). He is most popular among people who live in Central Alberta and the North (3.5 out of 10); those who live in rural areas (3.2); those in the private sector (3.2); and those aged 55 to 64 (3.2). However, those scores are barely above his overall average (3.1), and are still negative. Conversely, the premier is least popular among people in Edmonton and the South (2.6); public sector workers (2.6); women (2.8), and people aged 45 to 54 (2.8).
Figure 3. Mean Popularity Scores for Jason Kenney by Region and Community Size
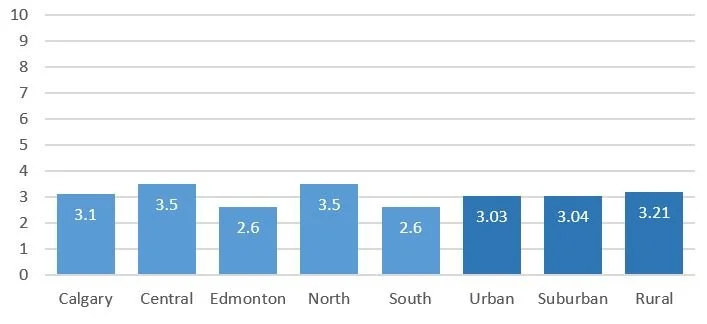
Source: Viewpoint Alberta Survey, April 2022. N=2151. Weighted data. Regions based on postal codes translated into Alberta Health Services zones. Community size based on question: “Which of the following best describes the area you live in?”
Figure 4. Mean Popularity Scores for Jason Kenney by Sector and Gender
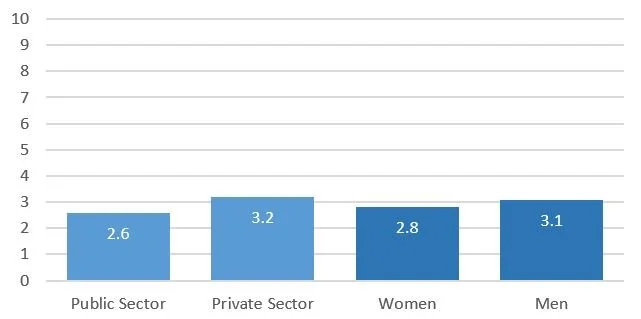
Source: Viewpoint Alberta Survey, April 2022. N=2151. Weighted data. Sector based on question: “Which of the following best describes your current or most recent work?”; “private sector” denotes “private sector, for-profit”. Gender based on response to: “Do you self-identify as… ?”
Figure 5. Mean Popularity Scores for Jason Kenney by Age Group
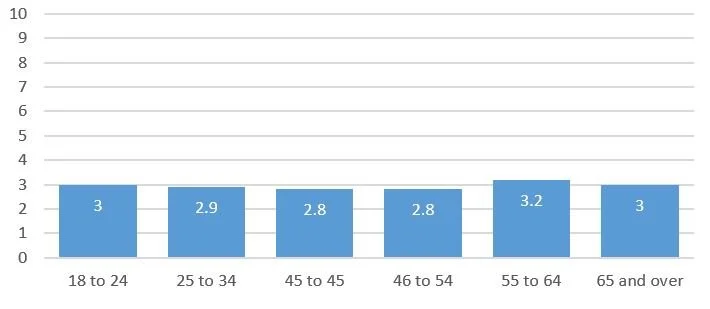
Source: Viewpoint Alberta Survey, April 2022. N=2151. Weighted data.
Economic security also appears to structure attitudes toward Premier Kenney (see Figure 6), with those who are less economically secure having less favourable impressions of the premier. Among people who agreed that “people like me are falling behind in society,” Kenney’s mean score is 2.7. This compares with higher ratings among people who do not feel like they are falling behind (3.3). We see similar variation when it comes to Albertans’ ability to meet their monthly expenses. People who find it “very easy” rate Kenney higher (3.3) than those who find it “very difficult” (2.9).
Figure 6. Mean Popularity Scores for Jason Kenney by Level of Economic Insecurity

Source: Viewpoint Alberta Survey, April 2022. Weighted data .Based on responses to the questions: “People like me are falling behind in society.” (n=857) and “In recent months, how easy or difficult has it been for you to meet your monthly expenses?” (n=857).
Kenney’s popularity appears tied to other types of political attitudes. In the Viewpoint Alberta survey, we asked respondents about their feelings toward the Freedom Convoy. Among people who sympathized with and shared the views of the protestors, Kenney’s mean popularity score was 4.8 out of 10. This compares with a score of 1.9 among those who did not sympathize or share their views (see Figure 7).
Figure 7. Mean Popularity Scores for Jason Kenney by Level of Sympathy for Convoy and Religiosity
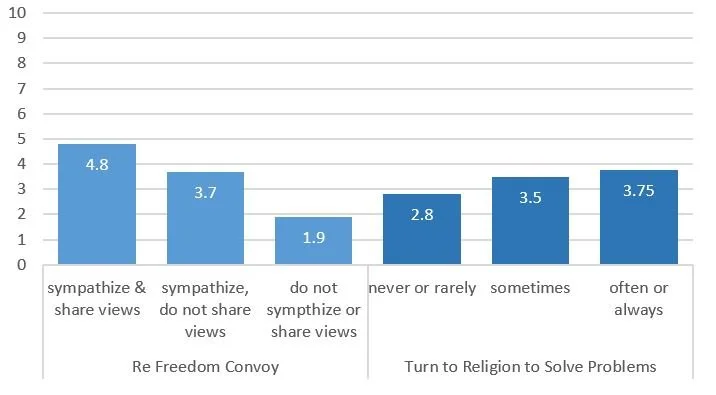
Source: Viewpoint Alberta Survey, April 2022. Weighted data. Based on responses to the questions: “Which of the following best represents your view of the trucker convoy protest?” (n=2151) and “How often do you turn to your religion to help you deal with problems in your life?” (n=2151).
To measure religiosity (which refers to the strength of one’s religious belief), we asked respondents how often they turned to religion to resolve problems in their lives. For people who answered “often” or “always”, Kenney’s popularity was higher (3.8) than for those who “never” or “rarely” turned to religion (2.8). This indicates that those with stronger connections to their religious identities have more favourable impressions of the premier.
Ideology and partisanship are by far the best predictors of attitudes toward Kenney (Figure 8). The premier’s mean rating ranges from 0.5 among Albertans who place themselves on the far left, to 5.5 among those on the far right. It is worth noting that most Albertans place themselves in the centre-left (24.3 percent), centre (26.7), or centre-right (35.3). People who identify as New Democrats (0.8) have a much lower view of Kenney (0.8) compared to people who identify with the United Conservative Party (5.0). This is noteworthy, in-and-of itself – among UCP-identifiers, Kenney’s average popularity is exactly half-way on a ten-point scale.
Figure 8. Mean Popularity Scores for Jason Kenney by Ideology and Party Identification

Source: Viewpoint Alberta Survey, April 2022. Weighted data. Based on responses to the questions: “In politics, people sometimes talk of left and right. Where would you place yourself on a scale from 0 to 10, where 0 means very left-wing and 10 means very right-wing?” (0 to 2 = far left; 3 to 4 = centre-left; 5 = centre; 6 to 7 = centre-right; 8 to 10 = far right) (n=2127); and “In Alberta provincial politics, do you usually identify with one of the following parties?” (n=2127).
Should He Stay or Should He Go?
Based on the negative attitudes Albertans hold towards the premier, it should not be surprising that most of them want Kenney to be removed as leader. More specifically, 6 in 10 Albertans believe UCP members should vote to remove Jason Kenney as party leader (see Figure 9). Only 21 percent of Albertans believe Kenney should stay, with a similar proportion unsure of what party members should do.
Figure 9. Attitudes about how UCP Members Should Vote in the Leadership Review, All Albertans
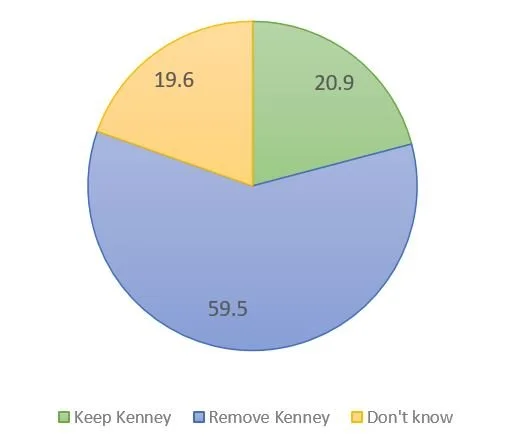
Source: Viewpoint Alberta Survey, April 2022. Weighted data. Based on the question: “Over the next month, Jason Kenney will face a leadership review by members of the United Conservative Party (UCP). How do you think UCP members should vote?” Responses included: “They should vote to keep him as leader”; “They should vote to remove him as leader”; and “Don’t know” (n=2150).
In the following analyses, we examine the views of Albertans who had formed an opinion on the leadership review. All demographic groups are in favour of removing Kenney from the leadership. Older Albertans were more likely to want to keep the premier than younger Albertans (see Figure 10), but even among the oldest demographic, less than one-third think he should pass the review. Calgarians and Northern Albertans were most likely to support Kenney’s leadership, while those in the South were most likely to want him removed (see Figure 11). There was very little variation among Albertans in urban, suburban, and rural areas, approximately a quarter of each supporting the premier. Finally, as illustrated in Figure 12, private sector workers (29.7 percent) and men (33.1) were more likely to support Kenney staying on as leader than public sector workers (22.2) and women (21.1).
Figure 10. Desired Outcome of Leadership Review by Age Group

Figure 11. Desired Outcome of Leadership Review by Region and Community Size
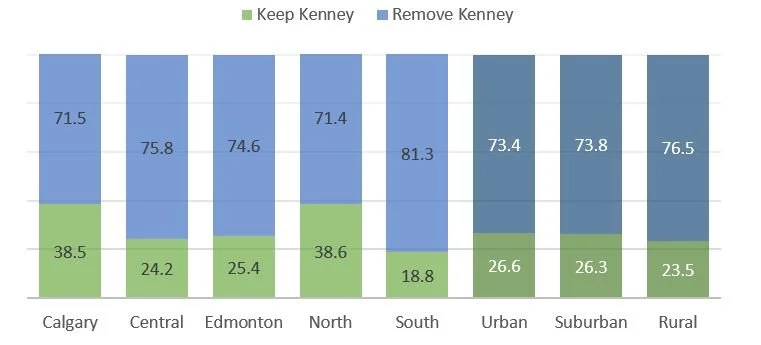
Figure 12. Desired Outcome of Leadership Review by Sector and Gender

Freedom Convoy sympathizers were more likely to support Kenney staying on; nonetheless, a majority of those Albertans (59 percent) still wanted the premier to leave (Figure 13). By comparison, 80 percent of those who did not sympathize with the protestors wanted the premier ousted.
Religiosity has an effect on support for Kenney in terms of the leadership review, as well (Figure 13). Just over one-third of people who often or always turn to religion to solve problems supported Kenney staying on as leader, compared to fewer than one-quarter of people who never or rarely turn to religion.
Figure 13. Desired Outcome of Leadership Review by Convoy Sympathy and Religiosity

Albertans experiencing economic hardship are less likely to want to see Kenney remain UCP leader (see Figure 14). Those who feel like they are falling behind in society (76.4 percent) or find it somewhat (80 percent) or very difficult (85.9 percent) to meet their monthly expenses wanted UCP members to remove Kenney from the leadership. People who did not feel like they were falling behind (69.8 percent) and who found it very (71.8) or somewhat (69.6) easy to meet monthly expenses still overwhelmingly wanted to see Kenney leave, but to a lesser extent than their counterparts.
Predictably, ideology and partisan identification also affected Albertans’ attitudes about the leadership review (Figure 15). Folks who positioned themselves on the far right (56.6 percent) and centre-right (64.5) still want Kenney to vacate the leadership, but these proportions are considerably lower than those in the centre (78.3), centre-left (82.8), and far left (86.1). Nearly all NDP identifiers (86.3 percent) want the party to oust Kenney, compared to 56.5 percent of UCP identifiers. This marks a rare case of partisan consensus.
Figure 14. Desired Outcome of Leadership Review by Level of Economic Insecurity
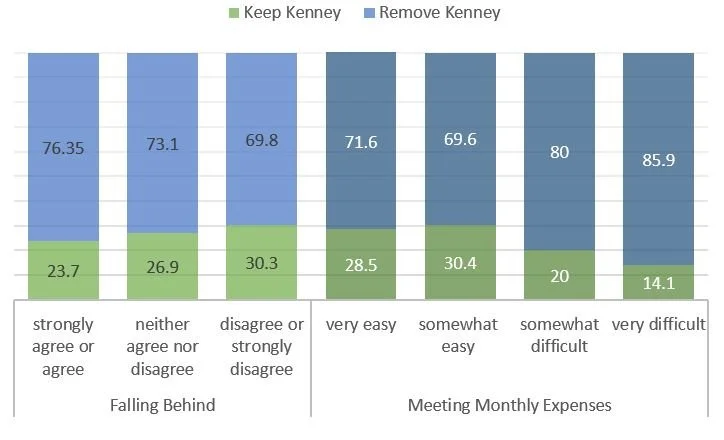
Figure 15. Desired Outcome of Leadership Review by Ideology and Party Identification

How Will it End?
While the majority of Albertans are in favour of Kenney’s departure from the UCP leadership, fewer believe that will actually be the outcome. Fewer than half (47.4 percent) think that Kenney will be removed, compared with 28.9 percent who think he will remain in power. Nearly one-in-four (24 percent) aren’t sure what the outcome will be (Figure 16).
Figure 16. Predicted Outcome of Leadership Review, All Albertans

Source: Viewpoint Alberta Survey, April 2022. Weighted data. Based on the question: “What do you think is the most likely outcome of the UCP’s leadership review?” Responses included: “Jason Kenney will win and remain leader of the UCP”, “Jason Kenney will lose and be removed as leader of the UCP”, and “Don’t know” (n=2150).
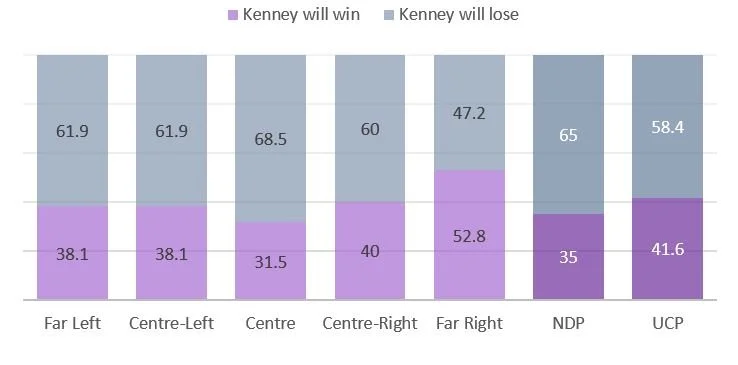
As shown in Figures 17-22, no demographic groups think Kenney will win the leadership vote, and the level of belief in his victory tracks similarly with levels of support for his leadership. The same is true with regard to Convoy sympathies, religiosity, and partisanship. The only group in Alberta that thinks Kenney will survive the leadership review is people on the far right. Interestingly, over half of them want to see him removed (see above).
Figure 17. Predicted Outcome by Age Group
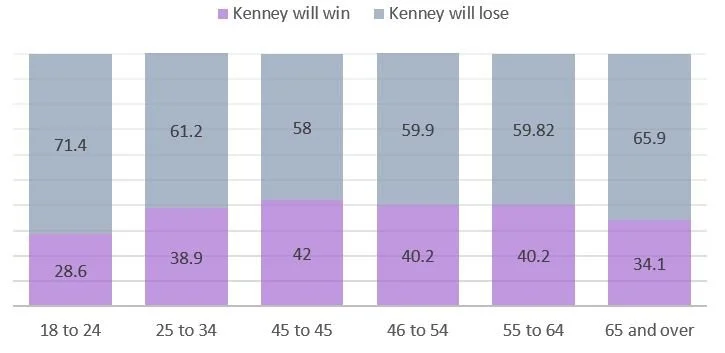
Figure 18. Predicted Outcome by Region and Community Size

Figure 19. Predicted Outcome by Sector and Gender

Figure 20. Predicted Outcome by Convoy Sympathy and Religiosity

Figure 21. Predicted Outcome by Level of Economic Insecurity

Figure 22. Predicted Outcome by Ideology and Party Identification
Confidence in the Process
Lastly, we asked Albertans whether they had confidence that the leadership review would be conducted fairly. This question reflects the fact that the party’s most recent leadership selection process is under active RCMP investigation, along with the fact that rule changes have occurred and irregularities in member registration have been reported in the current leadership review, itself.
Barely half of our respondents said they were somewhat (42.2 percent) or very confident (12.9 percent) the review would be conducted fairly. Thirty percent of respondents were not very confident and 14.9 percent not at all confident of the integrity of the review.
Figure 23. Confidence in the Fairness of the Review
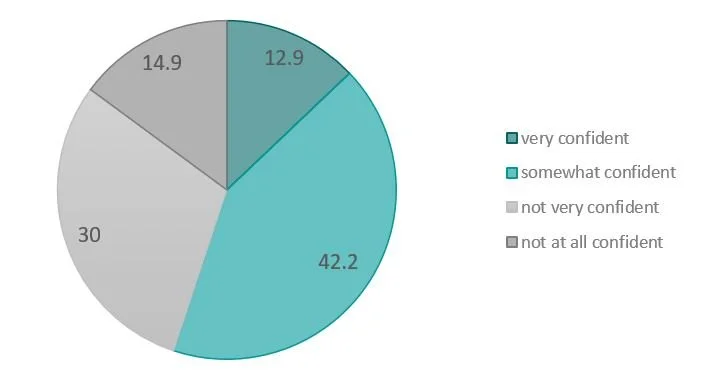
Source: Viewpoint Alberta Survey, April 2022. Weighted data. Based on the question: “How confident are you that the UCP leadership vote will be conducted fairly?” (n=2150).
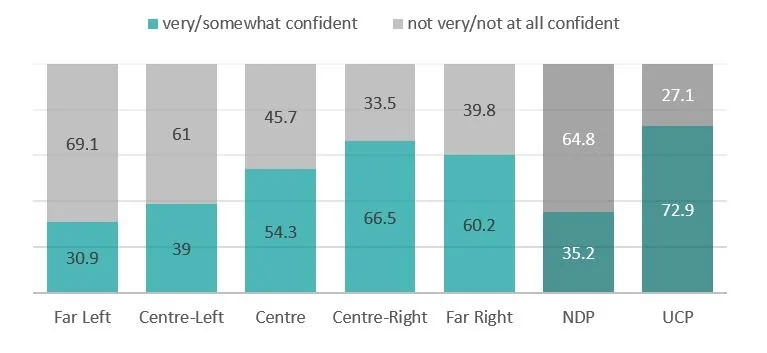
Demographically and attitudinally, confidence in the process varies along the same lines as our earlier measures of support for Kenney (see figures below). Those who sympathize with the Convoy protestors, those who are more religious, those who don’t feel like their falling behind, those who find it easier to meet monthly expenses, private sector workers, men, people on the right, and United Conservative Party identifiers are most likely to believe the process was fair. An exception to the results reported earlier, 18 to 24 year-olds (62.1 percent), are the most confident the results of the review will be fair.
Figure 24. Confidence in the Fairness of the Review by Age Group

Figure 25. Confidence in the Fairness of the Review by Region and Community Size
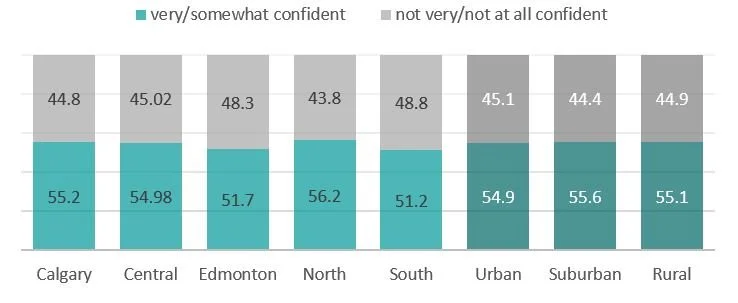
Figure 26. Confidence in the Fairness of the Review by Sector and Gender

Figure 27. Confidence in the Fairness of the Review by Convoy Sympathy and Religiosity

Figure 28. Confidence in the Fairness of the Review by Level of Economic Insecurity

Figure 29. Confidence in the Fairness of the Review by Ideology and Party Identification
What to Expect Next?
The results presented here are of the general public, and not of UCP members who registered to participate in the leadership review. While Albertans who identified themselves as UCP supporters in our survey want to see the premier leave and believe that will come to fruition, this does not necessarily mean that voting members feel the same way. To the extent that UCP members may disagree with the party’s base and the general public, this divergence will likely impact the party’s popularity and even legitimacy in the months leading up to the next provincial election.
According to our findings, if Kenney survives this leadership review, most Albertans will be disappointed and surprised at the actual result. Most want and expect him to lose. More than this, many Albertans appear poised to attribute a surprise result to an unfair process.
In the end, a Kenney victory could create instability on the political right in the province, with the potential for the splintering of the UCP support base between those who are supportive and those who are disillusioned by the outcome. Should he win, Premier Kenney will face a steep challenge to calm those widespread doubts in his leadership and the legitimacy of the process.
Methodology of the Viewpoint Alberta Survey
The Viewpoint Alberta Survey was conducted between April 8 and May 4, 2022. The survey was deployed online by Pollara. A copy of the survey questions can be found here: https://bit.ly/3LelxQi. Pollara co-ordinates the survey with an online panel system that targets registered panelists that meet the demographic criteria for the survey. Survey data is based on 2151 responses with a 15-minute average completion time. Split samples were employed for certain survey questions. The Viewpoint Alberta Survey was led by co-principal investigators Michelle Maroto, Feodor Snagovsky, Jared Wesley, and Lisa Young. It was funded in part by a grant from the Kule Institute for Advanced Study (KIAS) at the University of Alberta.