Economic Insecurity in Alberta over the Course of the Pandemic
Michelle Maroto | University of Alberta | maroto@ualberta.ca
Lisa Young | University of Calgary | lisa.young@ucalgary.ca
March 16, 2023
Experiences and Perceptions of Economic Insecurity Over the Course of the COVID-19 Pandemic
The World Health Organization officially declared COVID-19 a global pandemic on March 11, 2020. In the three years since that declaration, many aspects of Albertans’ lives have changed, but much has also remained the same. Three-years into the pandemic and it’s clear that, in addition to over half a million recorded COVID-19 cases in Alberta, 34,000 hospitalizations, and 5,500 deaths from the virus, the pandemic has also had larger effects on many people’s finances and economic situations.
Although many individuals initially struggled financially, as businesses closed and work hours were reduced, government-provided supports, such as the Canada Emergency Response Benefit (CERB), GST/HST rebate top-ups, and expansions to the Canada Child Benefit (CCB), soon helped to limit income losses for Canadians and Albertans. Economic changes in Alberta during the past three years, however, have also been linked to declining and then rising oil prices, as well as inflation, more generally.
What have these changing economic situations meant for experiences of economic insecurity in Alberta?
The Alberta Viewpoint Survey, which has been conducted in six waves since November 2019, provides an important opportunity to examine people’s experiences throughout the course of the pandemic. This brief uses data from five waves of the Alberta Viewpoint Survey (August 2020, March 2021, September 2021, April 2022, and January 2023) to examine changes in economic security, perceptions of financial situations and mobility, and optimism about the future throughout the course of the pandemic.
When asked in the January 2023 survey to retrospectively assess changes to their financial situations since March 2020, as presented in Figure 1, 49% of respondents reported that their financial situation has worsened, 36% said there had been no change, and 16% indicated improvements to their finances.
Figure 1: Change in Albertans’ financial situations since March 2020
SOURCE: AB Viewpoint Survey Jan. 2023 (N = 1215)
NOTES: Estimates based on weighted survey data. Responses to the question: “Comparing the financial situation of your life today to the way it was before the COVID-19 pandemic, would you say you are worse off, about the same or better off?”
Figure 1 indicates that, over the course of the pandemic, most Albertans have experienced at least some struggles within their financial situations. Combining this retrospective assessment with data over time then helps to demonstrate in more detail how finances and experiences of economic insecurity have changed.
Changing Experiences and Perceptions of Economic Insecurity Over Time
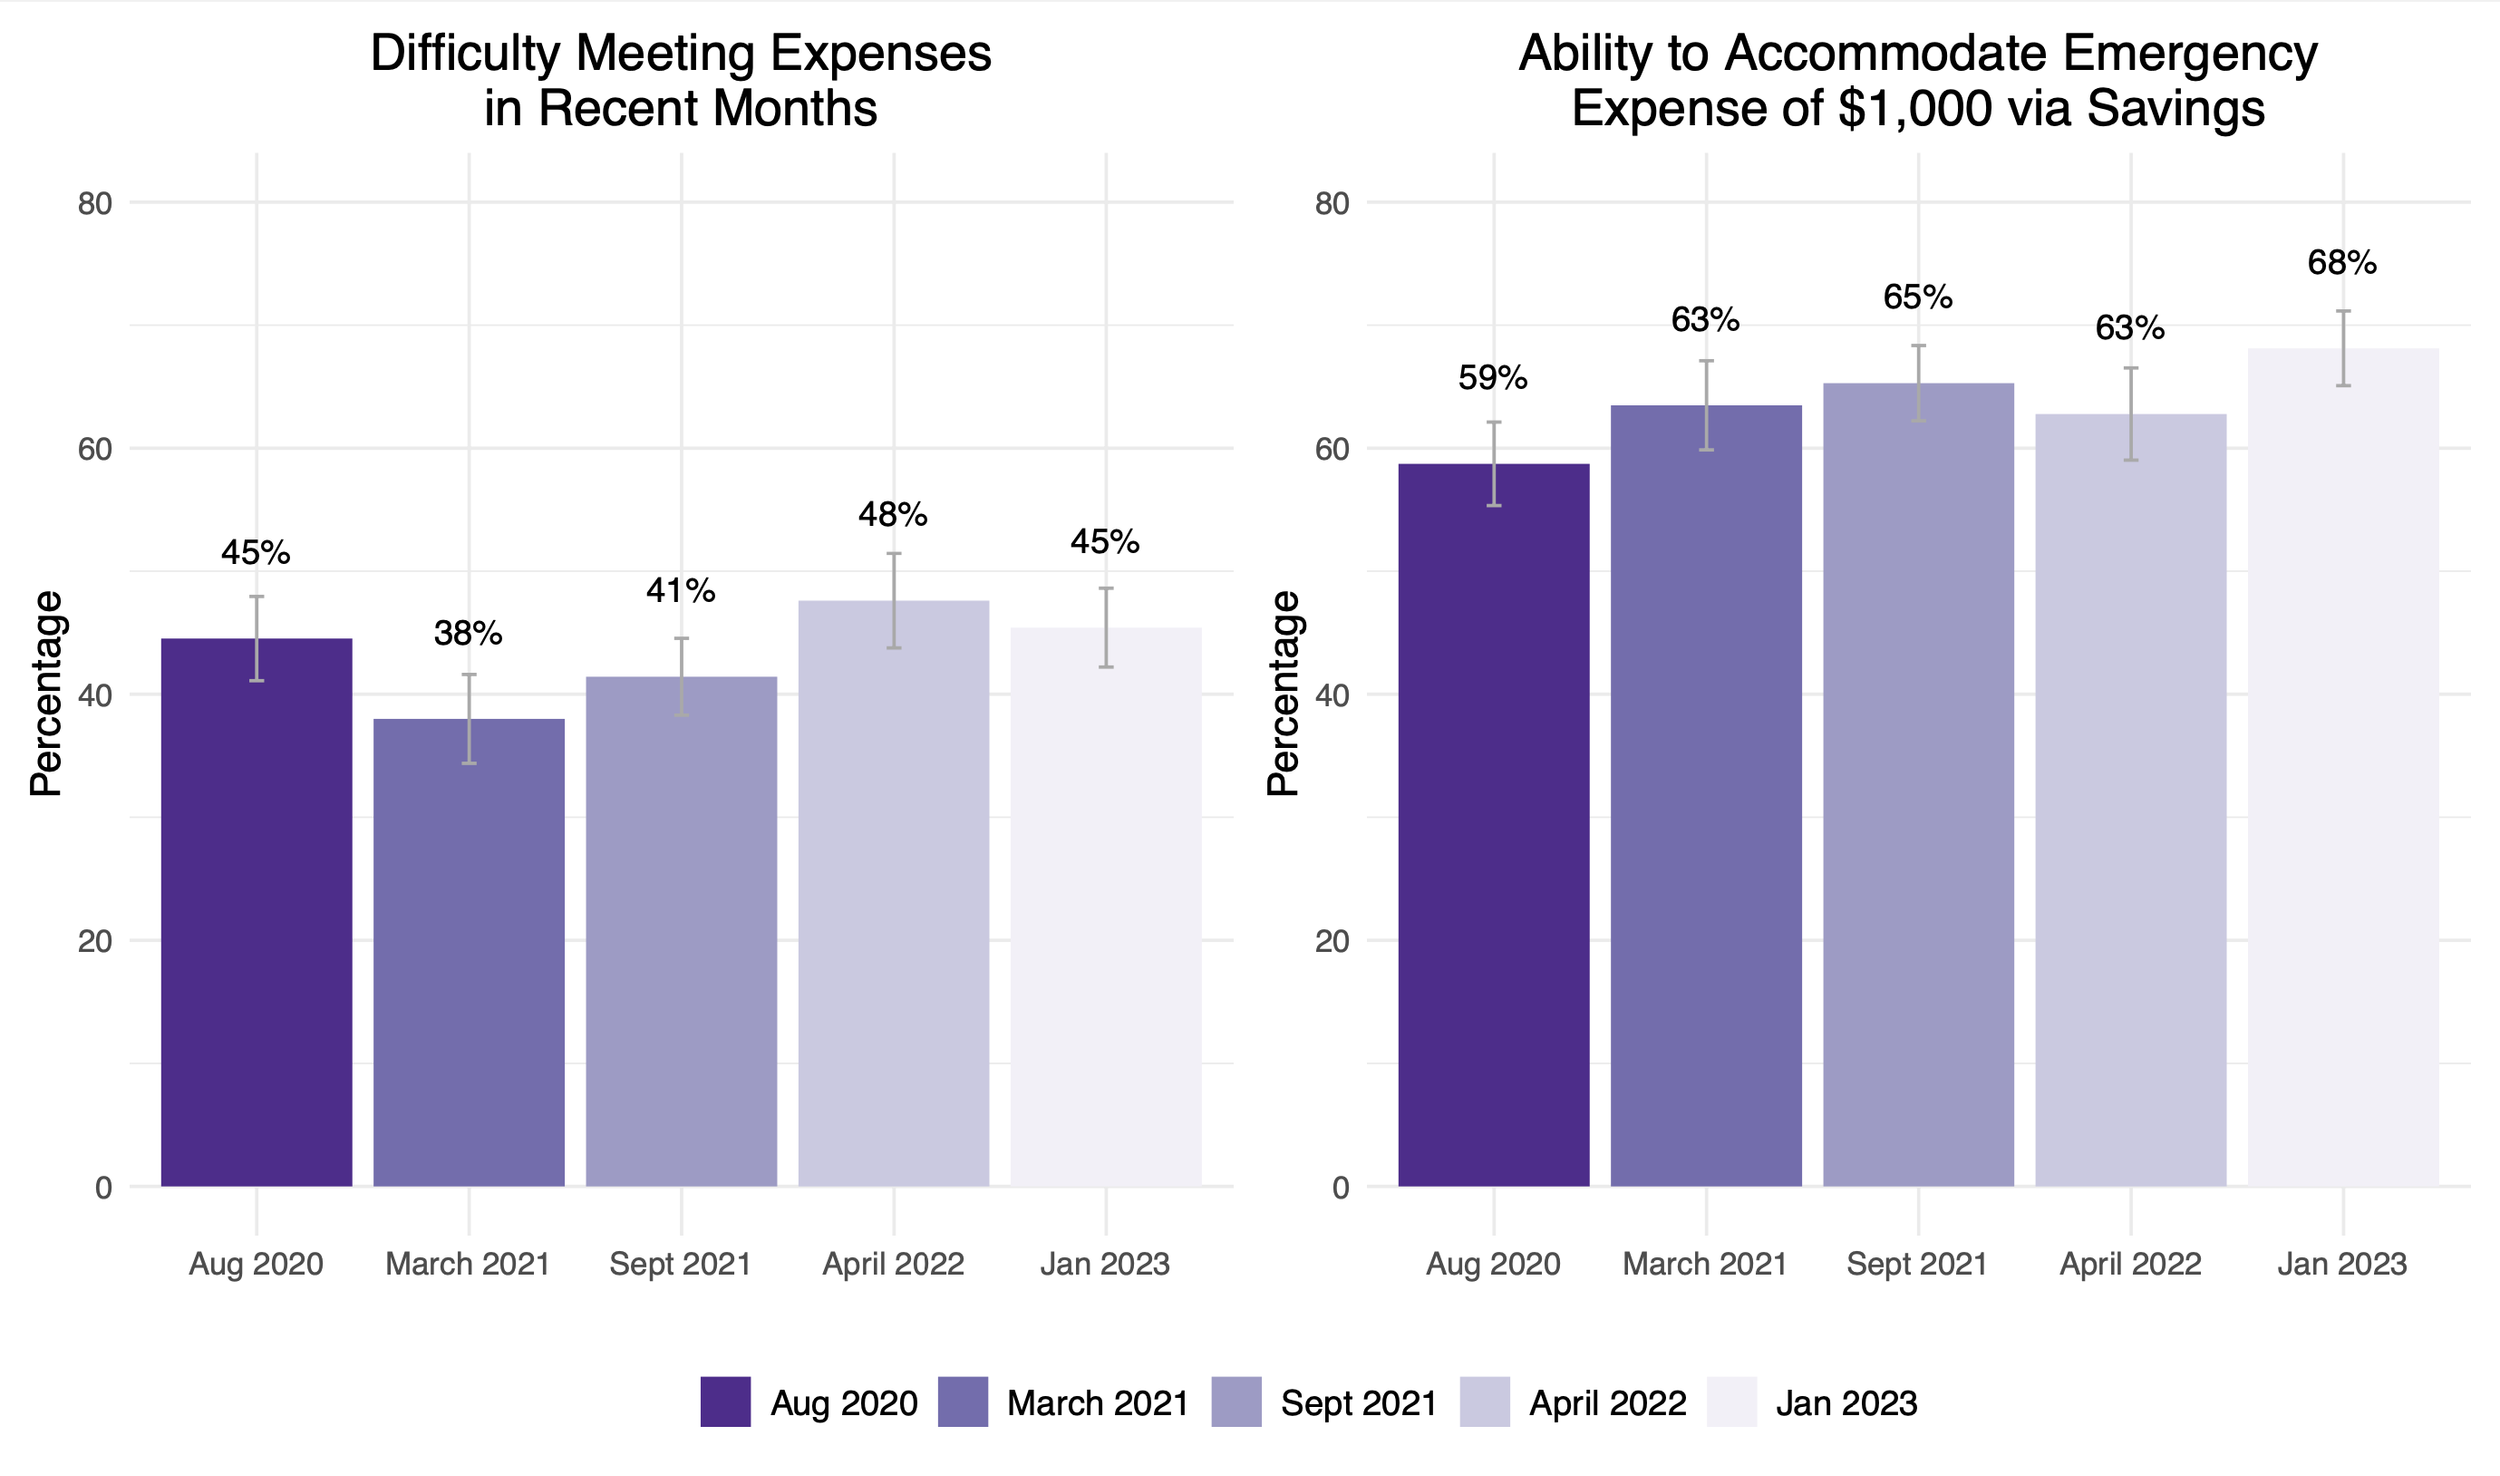
As measures of economic security and insecurity, Figure 2 reports the percentage of Albertans who indicated that they had difficulties in meeting their expenses over recent months and the percentage who reported that they would be able to accommodate an emergency expense of $1,000 through their savings alone. Over time, 38-48% of respondents had some difficulty in meeting expenses, but 59-68% were still able to accommodate emergency expenses through their savings.
Respondents were somewhat more likely to experience difficulties in meeting their expenses early in the pandemic and since April 2022. The lower percentages in 2021 could potentially be connected to the presence of pandemic-related supports, which helped to lessen the effects of the pandemic on inequality in the province. In terms of people’s abilities to accommodate emergency expenses, this ability appears to have increased over the pandemic. In August 2020, 59% of respondents reported being able to accommodate an emergency expense. By January 2023, this had increased to 68% of respondents.
Figure 2: Difficulty meeting expenses and ability to accommodate emergency expenses over time
SOURCE: AB Viewpoint Surveys - Aug. 2020 (N = 817), March 2021 (N = 802), Sept. 2021 (N = 1204), April 2022 (N = 845), Jan. 2023 (N = 1227)
NOTES: Estimates and 95% confidence intervals based on weighted survey data. Percentage of respondents reporting any difficulties in meeting expenses in recent months and their ability to accommodate an emergency expense of $1,00 using their savings alone by survey wave year.
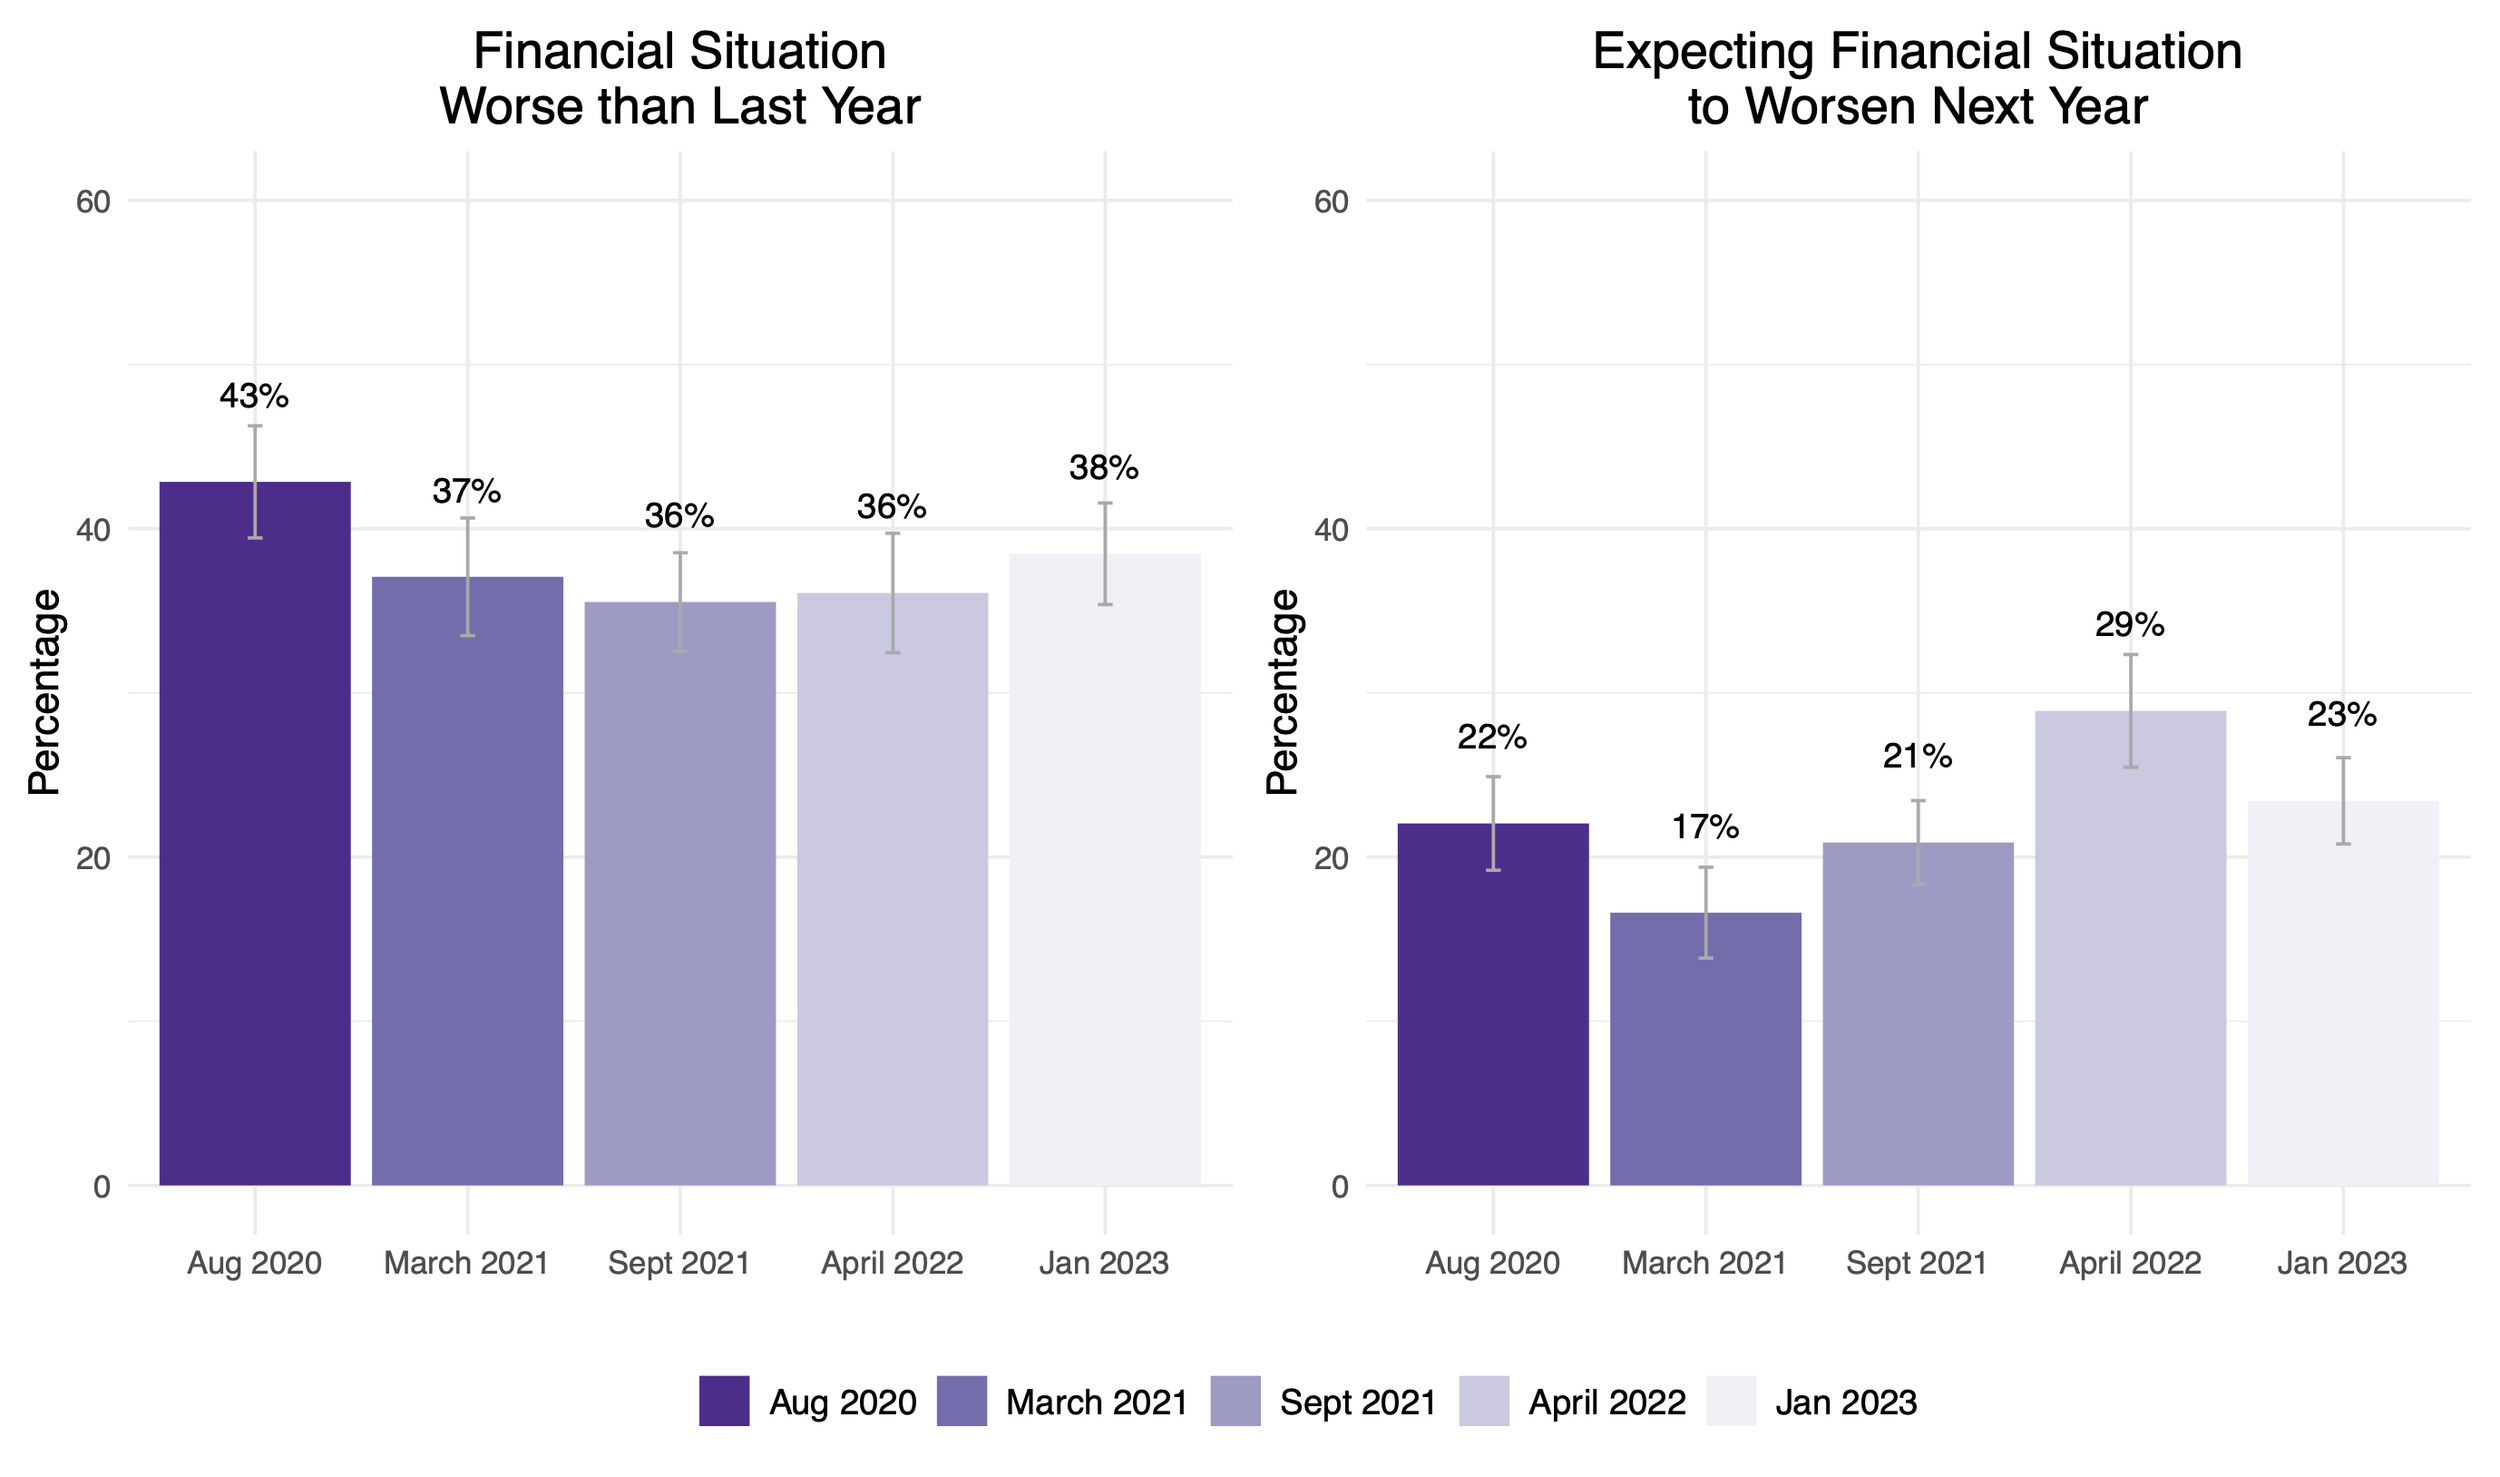
Figure 3 focuses more on respondents’ perceptions of their financial situations over time. It shows the percentages agreeing that their current financial situation was worse than the previous year and percentages agreeing that they expect their financial situation to worsen in the next year.
In August 2020, 43% of Albertans reported that their financial situation was worse than the previous year, likely reflecting some of the immediate economic impacts of the pandemic. This percentage then decreased in the following years. In regard to expectations for the upcoming years, individuals in April 2022 and January 2023 were more likely to report that they expected their financial situations to worsen in the coming year, concerns that could be linked to rising inflation in recent years.
Figure 3: Financial situations compared to previous year and expected for next year over time
SOURCE: AB Viewpoint Surveys - Aug. 2020 (N = 817), March 2021 (N = 802), Sept. 2021 (N = 1204), April 2022 (N = 845), Jan. 2023 (N = 1227)
NOTES: Estimates and 95% confidence intervals based on weighted survey data. Percentage of respondents agreeing that their current financial situation was worse than the previous year and percentage agreeing that they expect their financial situation to worsen in the next year.
Figure 4 again focuses on perceptions of economic security. It shows the percentages of respondents reporting that they believed it would be harder to move up the income ladder than their parents and the percentage reporting that they were optimistic about Alberta’s future. Across years, 44-49% of respondents reported that they believed upward mobility would be harder for them than it was for their parents. Although the percentage was slightly higher for April 2022, it did not change much over the course of the pandemic. Albertans’ optimism, however, appears to have increased in recent years. In August 2020, 35% of respondents indicated that they were optimistic about Alberta’s future. By January 2023, this had increased to 50% of respondents.
Figure 4: Perceptions of mobility and views of future over time
SOURCE: AB Viewpoint Surveys - Aug. 2020 (N = 817), March 2021 (N = 802), Sept. 2021 (N = 1204), April 2022 (N = 845), Jan. 2023 (N = 1227)
NOTES: Estimates and 95% confidence intervals based on weighted survey data. Percentage of respondents reporting that they believed it would be harder to move up the income ladder than their parents and the percentage reporting that they were optimistic about Alberta’s future. For Aug. 2020 data, the question about optimism specifically refers to Alberta’s economy and for all other survey waves, the question refers to Alberta’s future more generally.
Although there were some fluctuations throughout the pandemic, aggregate comparisons of experiences and perceptions of economic insecurity appear to be fairly stable over time. Experiences of insecurity were somewhat higher toward the beginning of the pandemic, but differences over time are small. The largest differences appear in regard to optimism about the future.
Varying Experiences and Perceptions of Economic Insecurity Across Groups
Even though experiences appear similar in the aggregate, it’s important to also consider how different groups’ experiences have changed throughout the pandemic. The next sets of figures examine how difficulties in meeting expenses and how optimism about Alberta’s future varied by gender, education, race, location, generation, and the presence of children in the household (Figures 5 and 6) and party affiliation and political ideology (Figures 7 and 8).
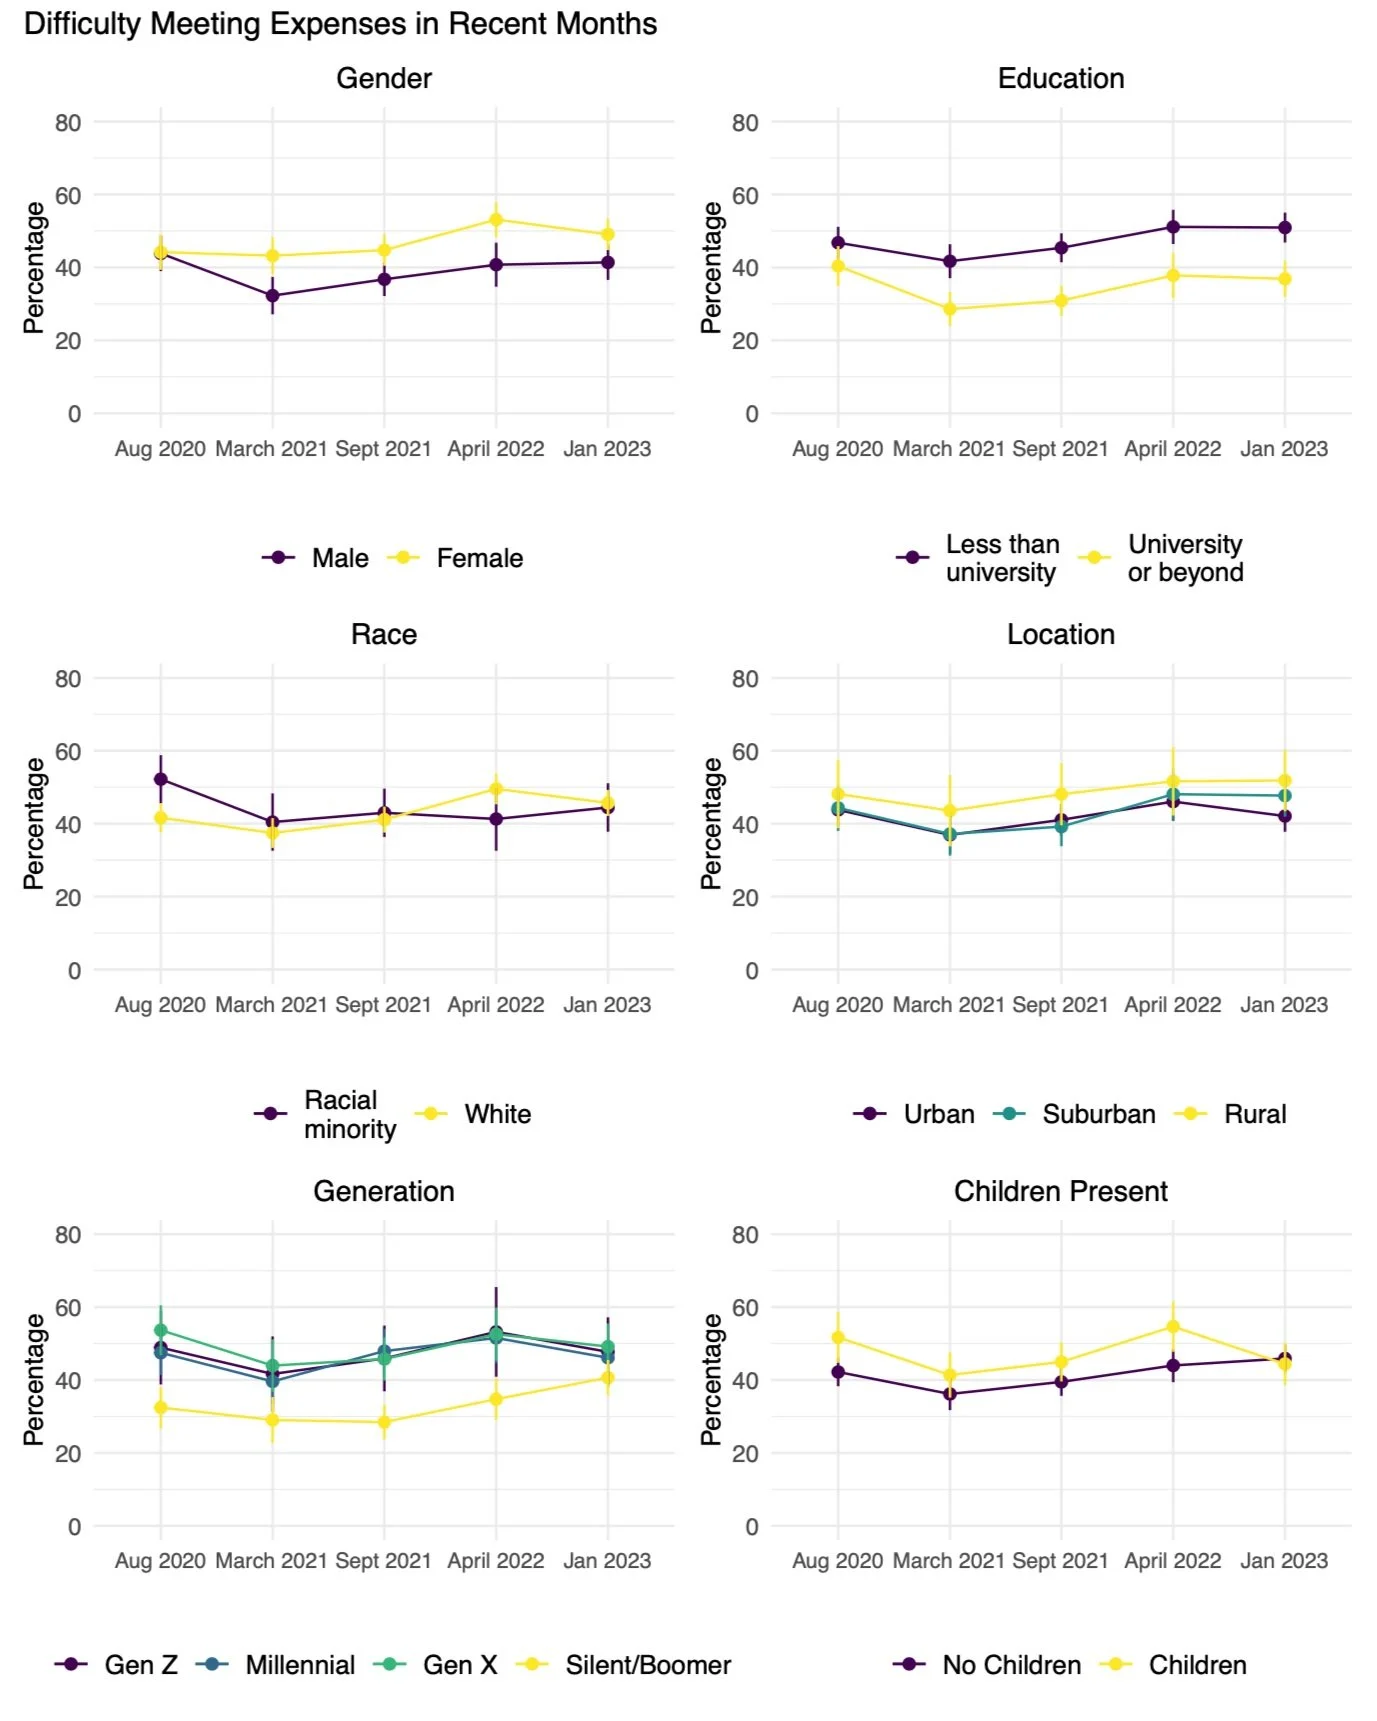
Examining respondents’ reported difficulties in meeting their expenses across groups shows a divergence in relation to gender and education over time. Similar percentages of men and women and people with different levels of education reported difficulties in meeting expenses in August 2020, which could be linked to larger economic struggles early in the pandemic. Over time, however, we start to see a greater proportion of women and individuals with less than a BA struggle to meet expenses. By January 2023, 49% of women compared to 41% of men reported difficulties meeting their expenses, and 51% of individuals with less than a university-level education compared to 37% of persons with a university degree or higher reported difficulties.
Fewer differences were present by race and location. Early on in the pandemic, racial minority groups reported greater struggles, but differences were not present after August 2020. Across locations, those living in rural areas tended to report struggling with expenses more, but these differences were small. Disparities were also present across generations. Members of the Silent and Boomer generations -- those born before 1964 -- were much less likely to experience economic insecurity throughout the pandemic. Finally, in most years individuals with children more often experienced insecurity.
As shown in Figure 6, it was much harder to identify patterns of economic insecurity in relation to political affiliation and ideology. Individuals affiliated with other parties that included the Liberal, Alberta, Green, and Wildrose parties were more likely to experience insecurity early on, but there has been a convergence of these experiences in the most recent January 2023 survey. There was also a good amount of overlap across political ideologies. Most recently in January 2023 it appears as though individuals on the far right of the spectrum have been experiencing lower levels of insecurity than other groups.
Figure 5: Difficulty Meeting Expenses in Recent Months across Groups
SOURCE: AB Viewpoint Surveys - Aug. 2020 (N = 817), March 2021 (N = 802), Sept. 2021 (N = 1204), April 2022 (N = 845), Jan. 2023 (N = 1227)
NOTES: Estimates and 95% confidence intervals based on weighted survey data. Percentage of respondents reporting any difficulties in meeting expenses in recent months by gender, education, race, location, generation, and the presence of children in the household.
Figure 6: Difficulty Meeting Expenses in Recent Months across Political Groups
Figure 7: Performance Evaluation by Party Identification
SOURCE: AB Viewpoint Surveys - Aug. 2020 (N = 817), March 2021 (N = 802), Sept. 2021 (N = 1204), April 2022 (N = 845), Jan. 2023 (N = 1227)
NOTES: Estimates and 95% confidence intervals based on weighted survey data. Percentage of respondents reporting any difficulties in meeting expenses in recent months by party affiliation and political ideology. Party affiliation is measured based on the question: “In Alberta provincial politics, do you usually identify with one of the following parties?” For consistency over time, respondents are grouped as UCP, NDP, and “Other,” which includes Liberal, Alberta, Green, and Wildrose Party members, as well as undecided respondents. Political ideology is based on responses to the question, “In politics, people sometimes talk of left and right. Where would you place yourself on a scale from 0 to 10, where 0 means very left-wing, and 10 means very right-wing?” Responses of 0-1 = far left, 2-4 = center left, 5 = center, 6-8 = center right, and 9-10 = far right.
Figures 5 and 6 show that experiences of insecurity have varied across groups during the pandemic with struggles more apparent for women, younger generations, and individuals with lower levels of education. Figure 7 and 8 show that perceptions of insecurity and Alberta’s future also vary across certain groups.
Overall, most Albertans have become more optimistic about Alberta’s future since August 2020. Across demographic groups in Figure 7, differences were only present by gender, race, and generation, and these differences tended to be small. Men were more likely than women to be optimistic about Alberta’s future with 56% of men and 43% of women reporting feelings of optimism in January 2023. Members of racial minority groups tend to be more optimistic than White Albertans. In 2023, 58% of racial minority group members were optimistic compared to 46% of White respondents. Finally, older generations tended to be more optimistic than younger generations over time. However, Gen Z -- those born since 1995 -- saw the greatest increases in optimism between April 2022 and January 2023. This resulted in a convergence across generation groups with 45-55% of each agreeing that they were optimistic about Alberta in January 2023.
Figure 8 shows larger gaps in levels of optimism by party affiliation and political ideology. Over time, optimism grew the most for individuals who identified with the United Conservative Party (UCP). In January 2023, 56% of UCP supporters reported being optimistic about Alberta’s future compared to 45-47% of NDP and Other party supporters. Across the political ideology spectrum, optimism tended to be higher on the right side of the spectrum with the largest increases for those who identify as center right and far right. Differences by political ideology were clearest in the January 2023 data. In this survey wave, 74% of far right respondents were optimistic about Alberta’s future compared to 30% of far left respondents.
SOURCE: AB Viewpoint Surveys - Aug. 2020 (N = 817), March 2021 (N = 802), Sept. 2021 (N = 1204), April 2022 (N = 845), Jan. 2023 (N = 1227)
NOTES: Estimates and 95% confidence intervals based on weighted survey data. Percentage of respondents reporting any difficulties in meeting expenses in recent months by gender, education, race, location, generation, and the presence of children in the household.
Figure 7: Optimism about Alberta’s Future across Groups
Figure 8: Optimism about Alberta’s Future across Political Groups
SOURCE: AB Viewpoint Surveys - Aug. 2020 (N = 817), March 2021 (N = 802), Sept. 2021 (N = 1204), April 2022 (N = 845), Jan. 2023 (N = 1227)
NOTES: Estimates and 95% confidence intervals based on weighted survey data. Percentage of respondents reporting any difficulties in meeting expenses in recent months by party affiliation and political ideology. See Figure 6 for description of party affiliation and political ideology.
Summary
What have varying economic situations over the course of the pandemic meant for experiences and perceptions of economic insecurity in Alberta?
Data from five waves of the Alberta Survey stretching back to August 2020 show that almost half of Albertans experienced some economic struggles during the pandemic that led them to report worsening financial situations after three years. Examining economic insecurity over time shows many ups and downs in respondents’ experiences. Over time this is evident in the greater proportion of Albertans who have been unable to meet monthly expenses in January 2023 compared to September and March of 2021. Despite these struggles, perceptions related to the potential for upward mobility and comparisons regarding recent financial changes have improved. Fewer respondents reported that their financial situations had worsened in recent survey waves and optimism about Alberta’s future increased substantially from August 2020 to January 2023.
These experiences and perceptions are not uniform across the province. Comparing different demographic groups’ experiences of economic insecurity shows that women, individuals with less education, and younger generations were more likely to report difficulties in meeting their monthly expenses. For many of these groups – particularly when comparing differences by gender and education – these disparities have grown since August 2020. Differences in levels of optimism were also reflected across political parties and ideology. UCP supporters and far right voters tended to be much more optimistic about Alberta’s future. They also saw larger increases over time.
Methodology of the Viewpoint Alberta Survey
The Viewpoint Alberta Survey was conducted between January 17 and February 9, 2023. The survey was deployed online by Leger. A copy of the survey questions can be found here: https://bit.ly/3Tk8Hpl. Leger co-ordinates the survey with an online panel system that targets registered panelists that meet the demographic criteria for the survey. Survey data is based on 1,227 responses with a 15-minute average completion time. Split samples were employed for certain survey questions. The Viewpoint Alberta Survey was led by co-principal investigators Michelle Maroto, Feodor Snagovsky, Jared Wesley, and Lisa Young. It was funded in part by a grant from the Kule Institute for Advanced Study (KIAS) at the University of Alberta.


